
I Have Traces From My Agent. Now What?
AI Agents in Production
Running an LLM agent in production, end to end: eval-driven testing before deploy, observing what it does in production with Langfuse, operating and improving on what you see, and securing the boundary with Bedrock Guardrails. Real failures and fixes from a live agent.
4 articles
In Part 2 of this series I set up tracing for my agent on Strands + Amazon Bedrock AgentCore with Langfuse, and closed on the loop that justifies the whole thing: a bad trace becomes a permanent eval case. But once it was published I realised I had skipped the most honest question, the one I asked myself on day one with the dashboard in front of me: okay, the traces are arriving… now what do I do with them?
This series walks the full cycle of taking an agent to production: test before deploying → observe what it does in production → operate and improve with what you see → secure the boundary. This is part 3, operate and improve.
Because observability isn’t the goal. Neither is staring at a nice dashboard for a while. The goal is to use what you see so the agent answers better next week than it does this week. This post is exactly that: the handful of things I actually do with traces, in order of how much each one has helped me, plus one thing I still have to build.
Don’t hunt for bad answers by eye
The first mistake I made was opening traces at random hoping to spot something off. With four requests a day that works; the moment there’s volume, it’s like reading logs line by line. It doesn’t scale and, more importantly, it’s not where the problem is.
What I do now is let the score take me straight to the suspects. The LLM-as-a-judge evaluator that already runs on every trace (I configured it in Part 2) leaves a number per answer (Conciseness, Hallucination), and the Scores tab has a search box that understands those values. A value:<0.5 over source:EVAL filters down to just the weak turns; name:Hallucination value:>0.5 pulls the answers that probably made something up.
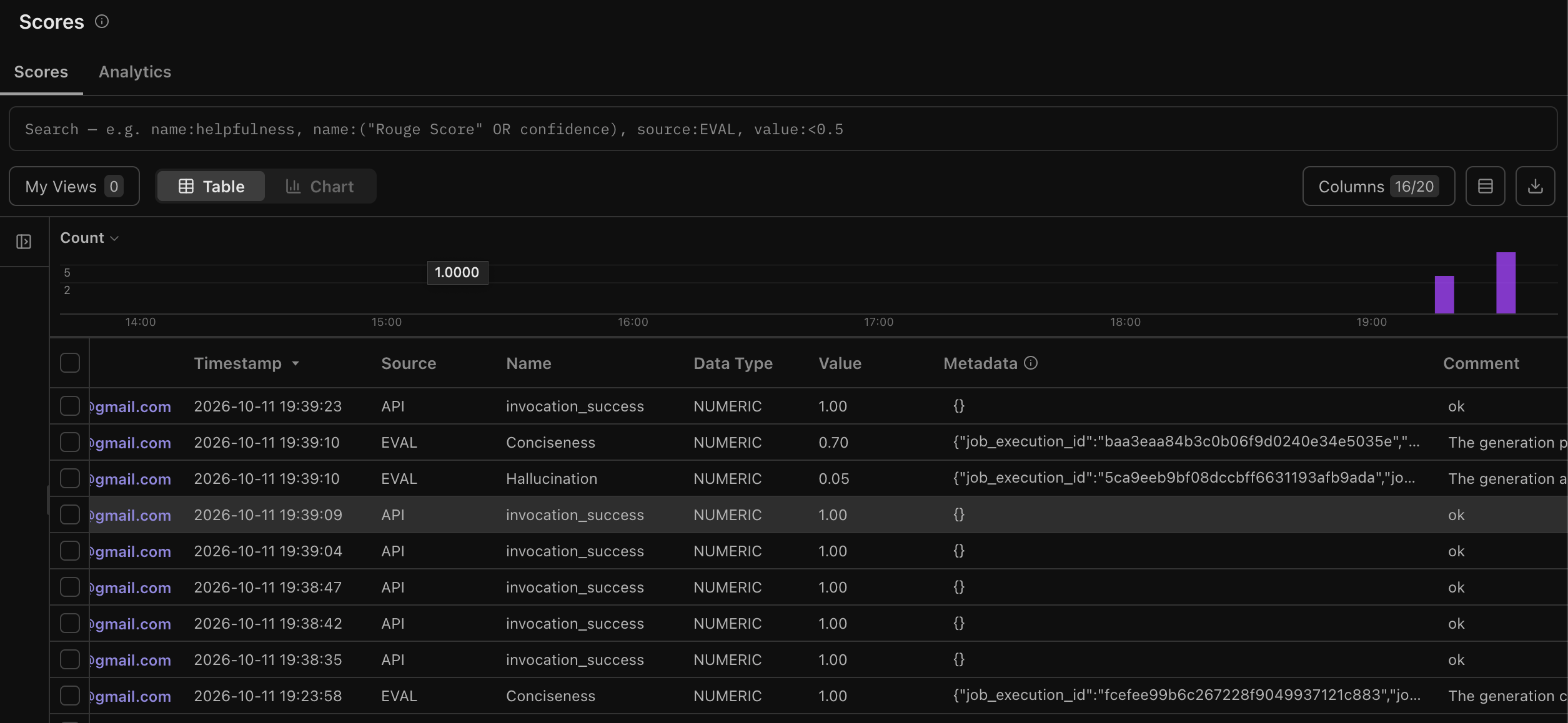
From a list of hundreds of requests I’m down to the five or six worth opening. And then yes: I open the trace, read the user’s question, see which tools it called and with what parameters, and the reason for the failure is almost always right there: it picked the wrong tool, it lacked context, or the system prompt pushed it to ramble. The score doesn’t tell me what to fix; it tells me where to look, which at volume is half the work.
Turn the failure into a test, not an anecdote
Finding a bad answer and fixing it by hand is tempting, but it’s work that evaporates: the next time you touch the prompt you have no way of knowing whether you broke it again. So when a trace exposes a failure pattern that repeats, I don’t close it: I turn it into a regression case.
It’s exactly the loop from Part 2 (from trace to eval), but seen from the day to day it’s a very simple routine: I find the bad turn by score, I pull the real user input and the property it should satisfy out of the trace (the right tool, the right parameter, the right language), and I add it to the suite that runs before every deploy. My most useful cases are deliberately boring assertions that came from real bugs, not from invented test prompts.
That’s the mindset shift: instead of testing three chats by hand every time I touch the agent, I accumulate the hard cases and run them all at once. What used to be “I think I didn’t break it” becomes “the suite says I didn’t break it”.
What traces teach you for free: tools, cost and latency
Not everything I get from traces is about hunting failures. There are two things I glance at that save me money and time without building anything extra.
The first is tool usage patterns. Opening the tree of an invocation shows me which tools were called and in what order, and Langfuse shows in the attributes panel both the tool name and its own description, the criteria the model used to decide to call it:
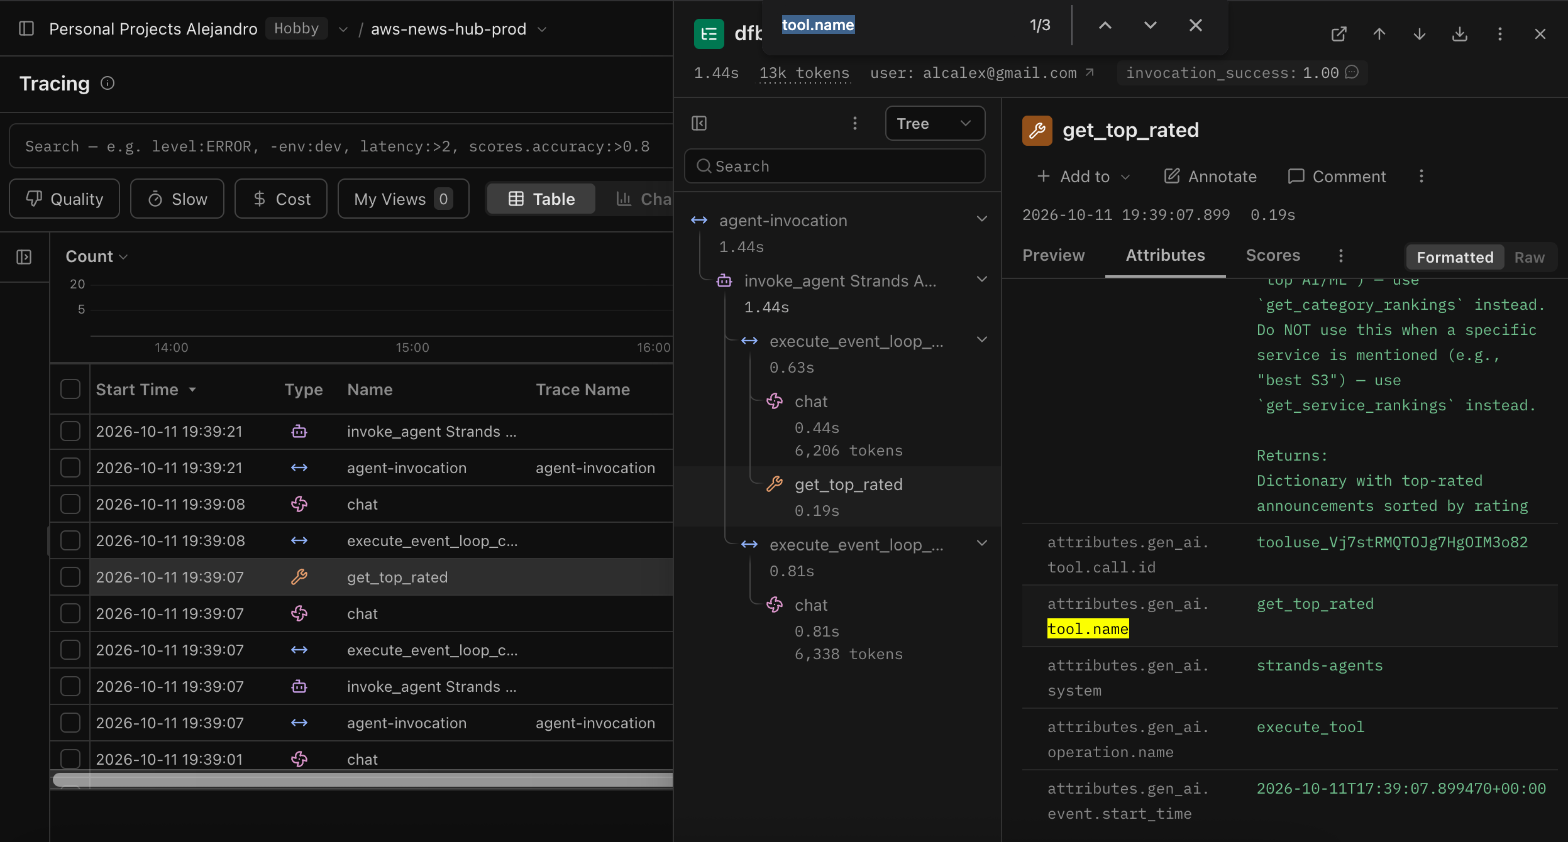
Seeing this together lets me catch things I wouldn’t otherwise notice: a tool that gets called every time and never adds anything, or the model chaining several event-loop cycles for something that should be direct. The cause is almost always an ambiguous tool description or a system prompt that pushes too hard, and it gets fixed there, not in the code.
The second is cost and latency. The Cost and Slow buttons sort traces by what hurts most, and with a per-token model that translates to the bill. Knowing which turns are expensive or slow tells me where to optimise before I have real traffic, not after the surprise arrives.
Neither one needs evaluators or configuration: they’re there from the moment the traces land.
What already runs, and what I still lack
Laid out in order, what I have running today is: the tracing that captures every invocation, and the LLM-as-a-judge evaluator that scores every trace in production. That’s the automation that genuinely matters, and it’s already in place. The rest (catching by score, turning into regression, looking at tools and cost) is work I do on top of that base.
And here’s the honest part: there’s a gap I haven’t closed yet. Right now, to find out something is degrading, I have to remember to look at the Scores. That works while the project is small and I check often, but it isn’t a real safety net. The next step I have pending is to set up an alert (Langfuse has them in v4) that pings me on its own if the average Hallucination climbs past a threshold, or if errors from the integration itself start coming in, so I hear about a drop without having the dashboard open. Until I have it, I’m the alerting system, and that’s exactly what I want off my plate.
If finding out something degraded means you have to remember to look at the dashboard, you don’t have a safety net: you have yourself. An alert on the average score is what turns observability into something that works for you.
If I had to sum up the method in one sentence: let the score take you to the bad traces, turn the ones that repeat into tests that run on their own, and put an alert on top so you don’t depend on your memory. The dashboard is nice; this is what makes the agent better.
The method in one line: let the score take you to the bad traces → turn the ones that repeat into tests that run on their own → put an alert on top so you don’t depend on your memory.
That closes the observability part of the series. What’s left is the agent’s other frontier (what happens when someone tries to manipulate it, or when a legitimate query trips a false positive), and I cover that in Part 4, My Agent Is Public. What If Someone Tries to Manipulate It?, because I see it as a security concern more than an observability one.
The agent I talk about in this post, the AWS Announcements Hub AI assistant, is the one you can try at news.playingaws.com.