
My Agent Is in Production. What Is It Doing in There?
AI Agents in Production
Running an LLM agent in production, end to end: eval-driven testing before deploy, observing what it does in production with Langfuse, operating and improving on what you see, and securing the boundary with Bedrock Guardrails. Real failures and fixes from a live agent.
4 articles
In Part 1 of this series I described the eval suite I run before deploying my AI agent: the one that catches it picking the wrong tool, passing the wrong parameters, refusing a valid request, answering in the wrong language, or giving back an answer that isn’t faithful to what the tool returned. That suite gives me a lot of confidence before a deploy.
This series walks the full cycle of taking an agent to production: test before deploying → observe what it does in production → operate and improve with what you see → secure the boundary. This is part 2, observe.
What it doesn’t tell me is anything about the day after, when a real user asks something that never occurred to me to put in an eval. And that is where an agent’s quality is really decided. To see that “day after” I needed traces, and this post is how I set them up on Strands + Amazon Bedrock AgentCore with Langfuse, what they taught me, and why the real prize isn’t a pretty dashboard but being able to turn a production failure into a permanent test.
What I wanted to see (and why logs aren’t enough)
For every request I wanted to be able to reconstruct the whole story: what exactly the user asked, which model calls fired, which tools ran and with which parameters, how long each step took, whether a guardrail intervened, whether it failed and how many tokens it cost.
Pieces of that fit into application logs. The problem isn’t having the data, it’s reconstructing it. An agent invocation isn’t one event: it’s a tree of model calls, orchestration steps, tools and AWS API calls, all hanging off a single question. I wanted to inspect that tree as one execution, not reassemble it by hand correlating log lines by timestamp. That’s what I use Langfuse for, in its managed cloud version (it has a free tier, more than enough for a project like this).
One thing worth clearing up here, because it’s the first question I get: I don’t use Langfuse because AgentCore is a black box. It isn’t. Amazon Bedrock AgentCore ships native observability integrated with Amazon CloudWatch: it traces execution, exposes sessions and traces, and gives latency, token and error metrics. I use both because they cover different workflows for me: AWS observability is the natural place to understand the runtime and the AWS side of the app, and Langfuse gives me an LLM-focused view where I see conversations, model calls, tool execution and evaluation signals together. I particularly like this path:
production trace → failing query → new eval → fix → deploy
If I wanted a fully AWS-native stack today, AgentCore Observability together with AgentCore Evaluations would be a perfectly reasonable option. This post is simply the setup I actually use.
Wiring Langfuse in without fighting the AWS telemetry
This was the part that took the most investigation, and the one I think can save you a headache. The key is understanding that OpenTelemetry has a global TracerProvider, and that both AWS and Langfuse want to use it. Strands emits OpenTelemetry telemetry; AgentCore injects AWS Distro for OpenTelemetry (ADOT) into the runtime and uses it for its native observability; and Langfuse speaks OpenTelemetry too. If two integrations both assume they own that provider, things get tangled fast.
First, a hygiene decision: I separate test from production into two different Langfuse projects, so I never mix my local eval runs with real users.
| Project | Traffic |
|---|---|
| test | Local eval suite and non-production agent |
| prod | Real production requests |
Langfuse supports environment metadata, so splitting into two projects isn’t mandatory; I prefer the hard separation. When I open production, I know I’m looking at production and nothing else.
With that done, there are two paths. If you only want Langfuse, the official integration documents the direct route: set DISABLE_ADOT_OBSERVABILITY=true, configure the OTLP endpoint and headers, and you’re done. If Langfuse were all I cared about, I’d take that without a second thought.
But I wanted both destinations at once, without giving up the AWS telemetry path:
1
2
3
                  ┌──► AWS observability
Strands ─► OTEL ──┤
                  └──► Langfuse
The trick to pull that off is not to create a second global TracerProvider, but to attach Langfuse as one more exporter on the provider ADOT already set up. All the extra code boils down to this:
1
2
3
4
5
6
7
8
9
10
11
12
13
14
15
16
17
18
19
import base64
from opentelemetry import trace as otel_trace
from opentelemetry.sdk.trace import TracerProvider as SdkTracerProvider
from opentelemetry.sdk.trace.export import BatchSpanProcessor
from opentelemetry.exporter.otlp.proto.http.trace_exporter import OTLPSpanExporter


def setup_langfuse_otel(public_key, secret_key, host):
    provider = otel_trace.get_tracer_provider()
    if not isinstance(provider, SdkTracerProvider):
        return   # ADOT hasn't set it up yet; I don't install a new one

    auth = base64.b64encode(f"{public_key}:{secret_key}".encode()).decode()
    exporter = OTLPSpanExporter(
        endpoint=f"{host}/api/public/otel/v1/traces",
        headers={"Authorization": f"Basic {auth}",
                 "x-langfuse-ingestion-version": "4"},
    )
    provider.add_span_processor(BatchSpanProcessor(exporter))   # <- reuse the provider that already exists
The one line that really matters is provider.add_span_processor(...): I reuse the provider that already exists instead of installing another global one. This bit is also the most version-sensitive piece of the whole integration (OpenTelemetry, AgentCore, Strands and Langfuse all evolve on their own), so I keep it small and isolated on purpose.
Don’t create a second global
TracerProvider: if both ADOT and Langfuse try to own the provider, your telemetry tangles and you end up debugging spans that vanish. Attach Langfuse as one more exporter on the provider ADOT already set up.
With export sorted, I wrap each full request in a root span, so Strands’ internal spans, model calls and tools all hang off a common execution context:
1
2
3
4
5
6
7
8
9
10
11
12
13
14
15
16
17
18
19
from opentelemetry import trace as otel_trace
from opentelemetry import context as otel_context

tracer = otel_trace.get_tracer("aws-announcements-agent")
root_span = tracer.start_span("agent-invocation", attributes={
    "langfuse.trace.name": "agent-invocation",
    "langfuse.trace.user_id": user_id,
    "langfuse.environment": environment,
})
token = otel_context.attach(otel_trace.set_span_in_context(root_span))
try:
    response = await run_agent(prompt)
    root_span.set_attribute("status", "ok")
except Exception:
    root_span.set_attribute("status", "error")
    raise
finally:
    otel_context.detach(token)
    root_span.end()
My actual code also stores request and response metadata, and handles the guardrail path so a blocked invocation doesn’t vanish from observability. I tag three operational outcomes (ok, guardrail, error) and, on purpose, I don’t call them “quality scores”: a request can finish perfectly and still produce a bad answer. Operational outcome and answer quality are different signals, and mixing them only confuses you later.
What a good trace teaches me
With this in place, any request produces a tree like this one, and I can walk the whole thing:
1
2
3
4
5
6
7
agent-invocation
  ├── execute_event_loop_cycle
  │     ├── chat
  │     │     └── Bedrock model invocation
  │     └── compare_services
  │           └── S3.GetObject
  └── DynamoDB.GetItem
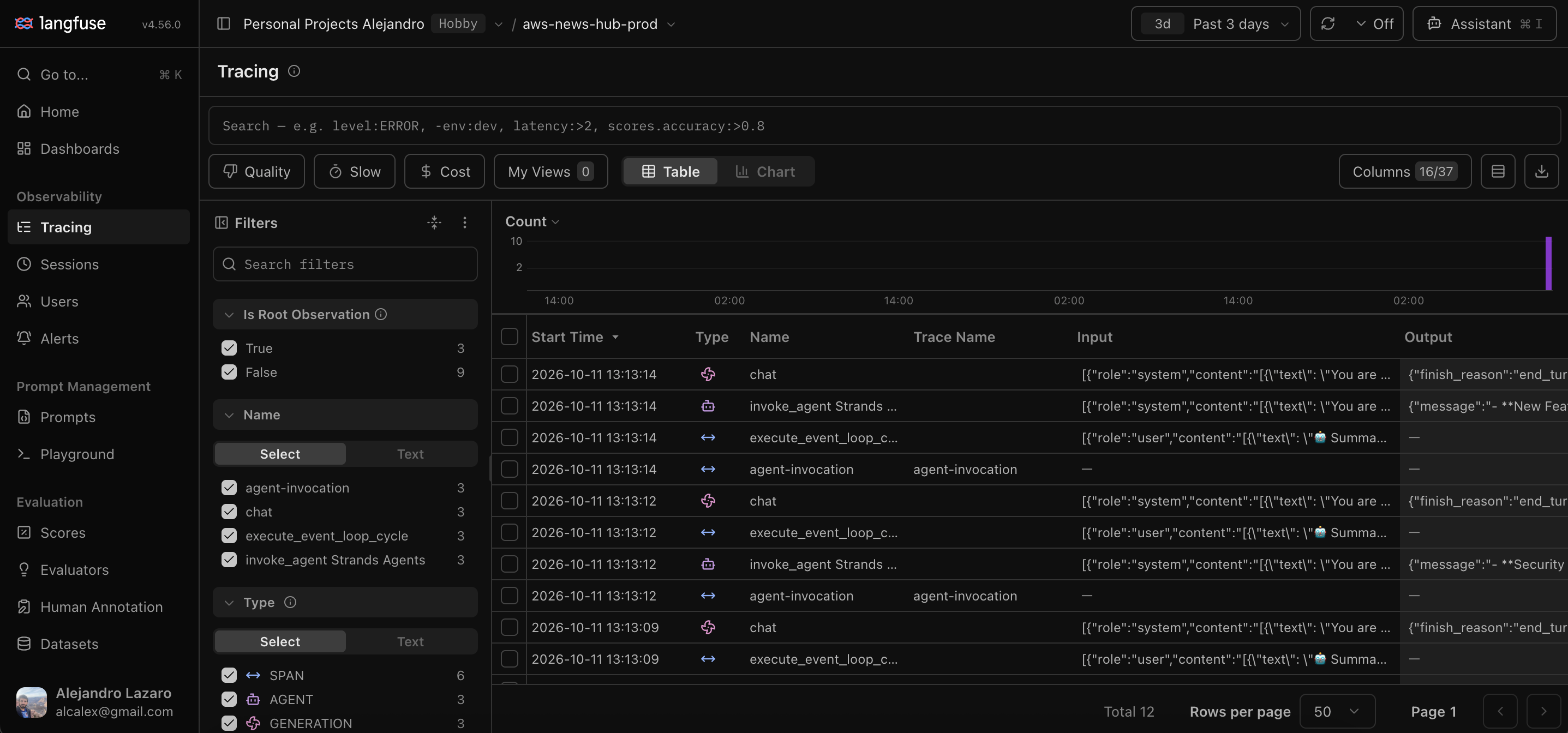
Here’s what it looks like in Langfuse. The trace list gives me the bird’s-eye view, each invocation with its chat, invoke_agent and execute_event_loop_cycle spans:
And opening a single trace gives me the real tree with its per-span latency timeline, the model used (eu.amazon.nova-2-lite), the tokens, and the evaluation signals (Conciseness, Hallucination) already attached at the top:
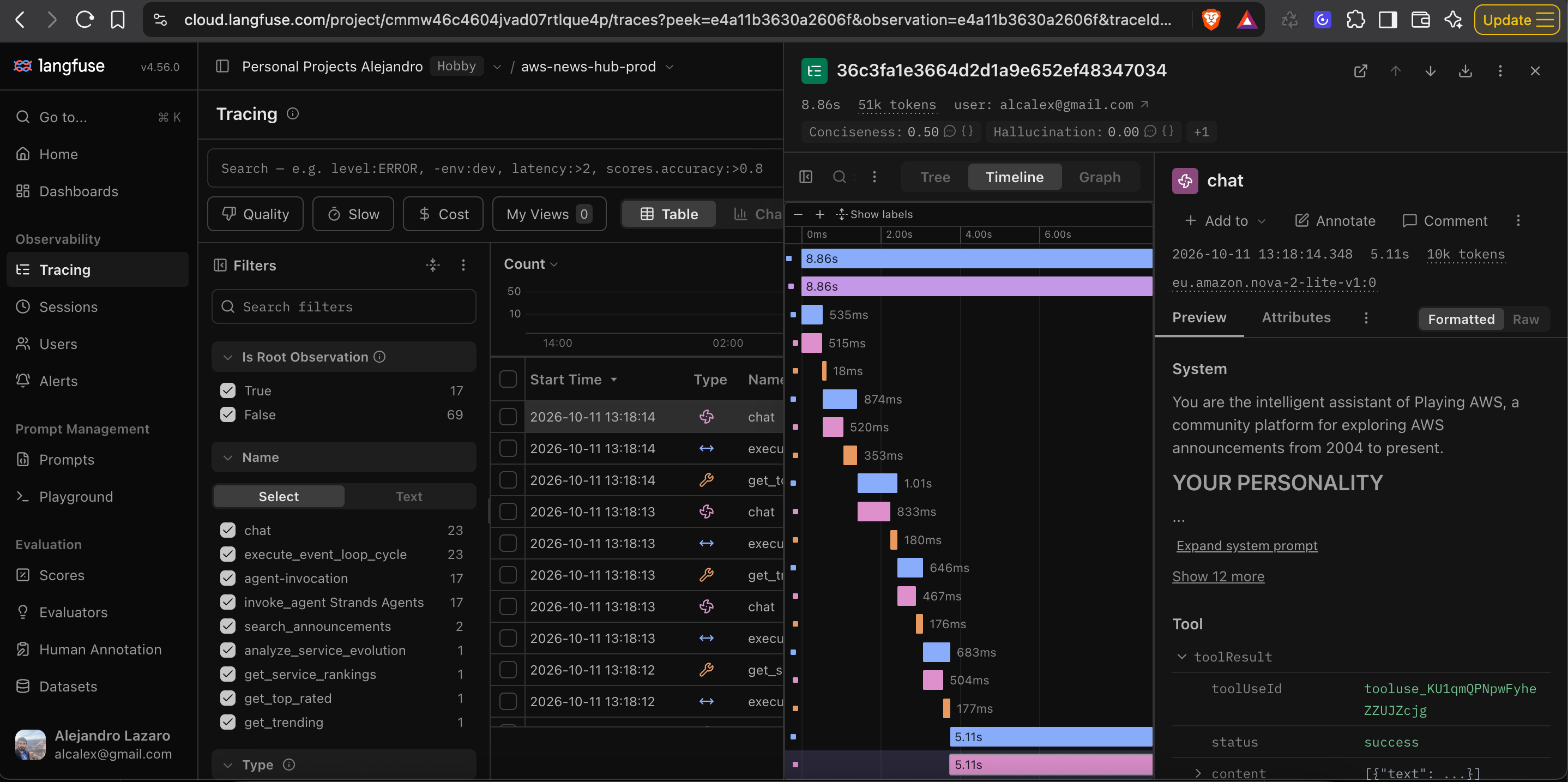
Looking at it, I can answer things I used to only guess at: whether the agent actually searched, whether it called an extra tool, which sort_order it used, whether the delay was in the model or an AWS API, whether the guardrail cut the request off, how much context reached the model, and what the user got in the end. And the most useful lesson is counterintuitive: the traces that matter most are almost never the hard failures. A 500 is obvious. The dangerous one is the confident, apparently flawless answer produced with the wrong tool parameter. That shows up in no error log, and it’s exactly what a trace lets you see.
The traces that matter most are almost never the
500s: you already see those. They’re the confident, plausible answers produced with the wrong parameter, which no error log records.
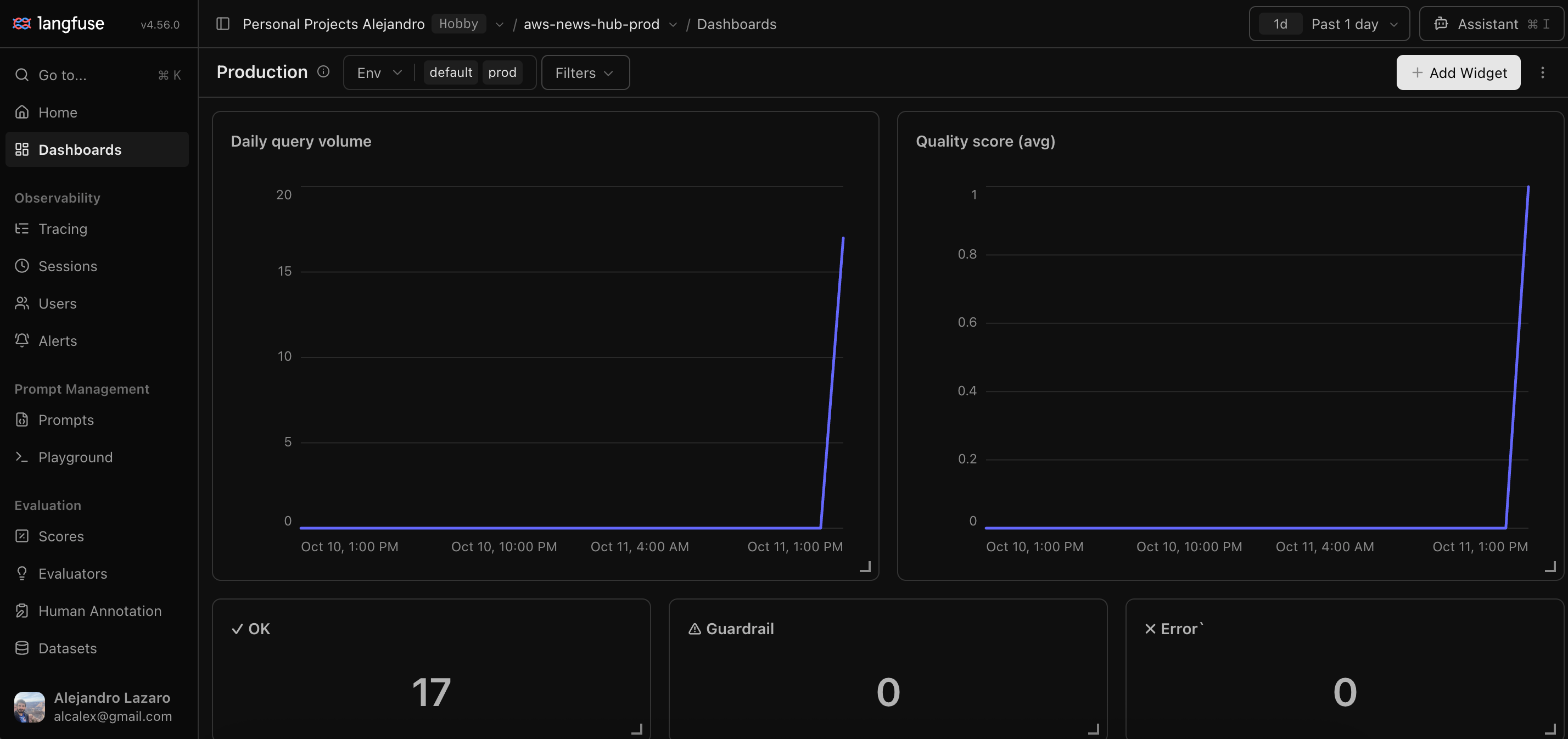
My initial instinct, by the way, was to build a dashboard on day one. In practice I learned far more reading individual traces one at a time. Only once I had enough traffic did I add a small production view, around the signals that actually drive me to act: invocation volume, latency, errors, guardrail interventions, token usage and evaluation signals. I don’t turn every available metric into a widget; if a graph doesn’t lead me to an action, I don’t need it.
From one bad trace to a permanent test
This is the underlying reason I keep the whole tracing setup, and the moment the series closes on itself. Suppose a real user asks:
what was the first announcement about serverless?
The answer is wrong. I open the trace and go straight to the tool span, where Langfuse shows me the name of the tool the model picked and the exact arguments it called it with, precisely what an error log would never give me:
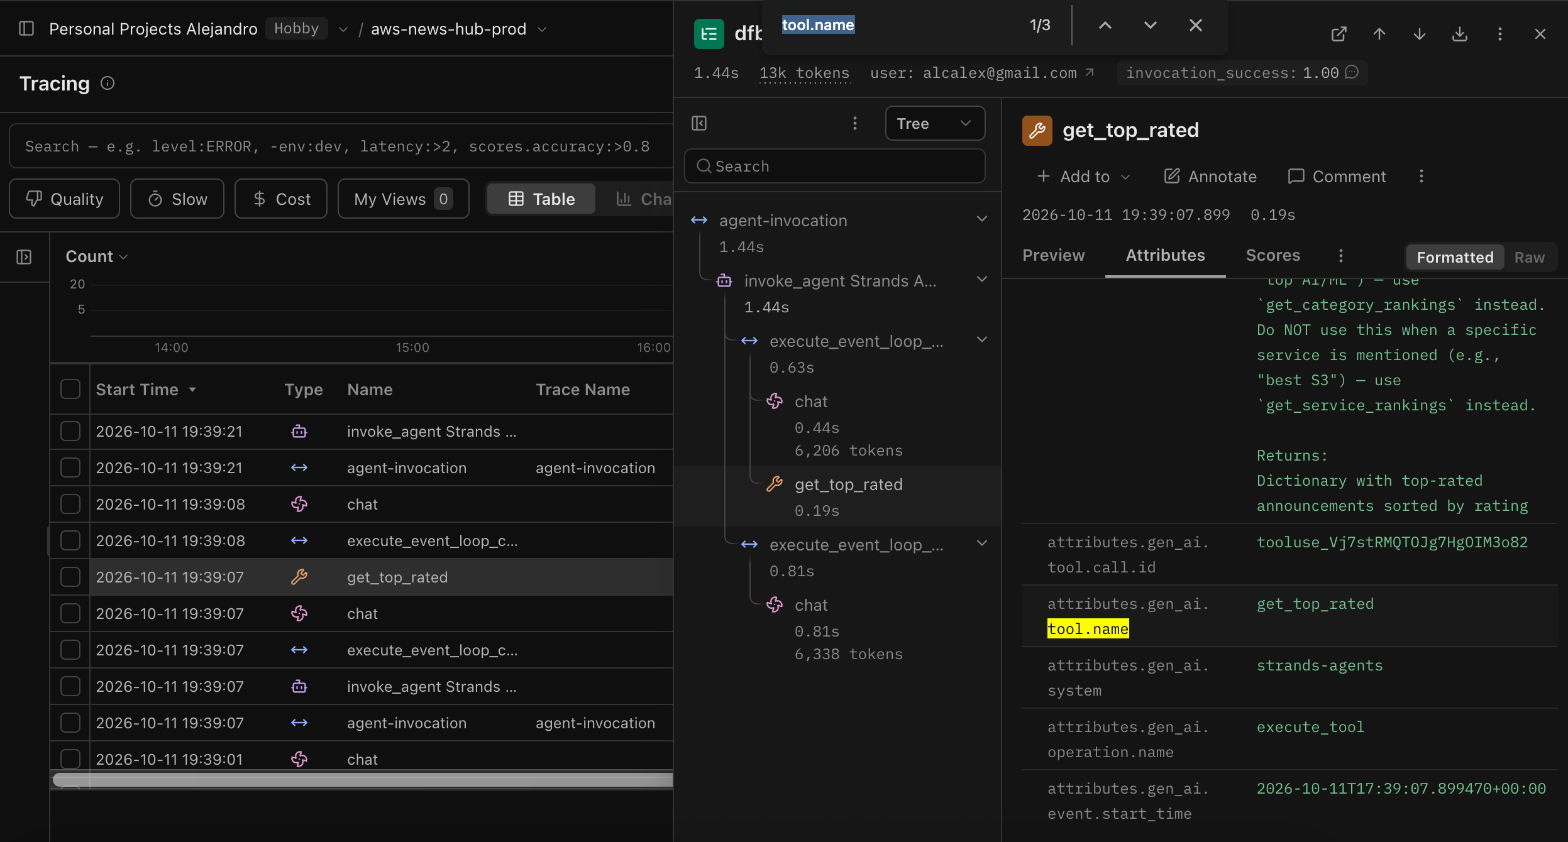
And there’s the problem, in plain sight in the parameters:
1
search_announcements(query="serverless", sort_order="desc")
From here the problem stops being the usual “the AI gave a bad answer”, which you can neither reproduce nor fix, and becomes something concrete and actionable:
1
2
input:    "what was the first announcement about serverless?"
expected: sort_order="asc"
That query becomes a new parameter eval in the suite from Part 1. And the whole cycle looks like this:
flowchart LR
    A[Production failure] --> B[Inspect the trace]
    B --> C[Add an eval case]
    C --> D[Reproduce locally]
    D --> E[Fix prompt, tool schema or code]
    E --> F[Run the suite]
    F --> G[Deploy]
The dashboard is nice, but it’s this feedback loop, not the graphs, that justifies having the tracing in place.
There’s one kind of trace I keep for a different reason: Amazon Bedrock Guardrails interventions. Two very different kinds of traffic land there (someone genuinely trying to manipulate the agent, and a legitimate query that trips a false positive) and both add to the same “guardrail” counter. Only the trace tells me which one happened. That’s why I don’t treat a guardrail intervention as an error or a low quality score: it’s an operational outcome that needs interpreting. I cover the Guardrails configuration in Part 4 of this series, because I see it as a security concern more than part of the testing stack.
Evaluating in production, in moderation
So far I’ve covered how I see what happens. But seeing a trace is one thing; using it to improve the agent day to day is another: catching the bad answers by score instead of by eye, turning the ones that repeat into regression tests, and putting an alert on top so I don’t depend on my memory. Langfuse also scores in production with an LLM-as-a-judge, and AgentCore Evaluations offers managed evaluation on the AWS side. All of that (what I actually do with traces once they arrive) I cover in Part 3, I Have Traces From My Agent. Now What?, to keep this post from bloating, since it’s about setting up observability, not operating it.
If I had to instrument another small agent tomorrow, I’d start with less than I planned the first time: capture one complete invocation, make sure the model and tool spans hang below it, store the input and final output I need for debugging, separate test from production, record operational outcomes (ok, guardrail, error), and above all read the traces. No elaborate dashboard and no dozen evaluators. First make the agent observable; which metrics are worth graphing becomes obvious the moment you have real traffic to look at.
Seen from the outside, the whole series describes the same loop from both sides: before deploying, unit tests plus the behavioral/parameter evals plus the quality evals; after deploying, the real request → the trace → the new failure → the new eval → the fix → the deploy. The suite protects the behaviours I already know matter; production traces find the next one. That’s what finally made touching the agent feel less like changing a prompt and crossing my fingers.
The agent I talk about in this post, the AWS Announcements Hub AI assistant with its evals and its observability integration, is the one you can try at news.playingaws.com.